Resolute B.I.
Web
My Role
Lead Designer
UX Research
Background
Resolute Building Intelligence provides fault detection, analytics, and reporting solutions through its two applications, Synergy and Fusion. By connecting to a building’s existing BAS, Resolute B.I. delivers insights using rule-based analytics and reports, helping users better understand performance and identify potential issues.
Prior to Synergy, Resolute relied on third-party integration tools along with an internal development tool to configure its analytics platform.
Building integration is traditionally slow, manual, and highly technical. Integrators often work with inconsistent data structures, unclear naming conventions, and large volumes of raw data. This led to:
Time-consuming setup processes
Increased risk of mapping errors
Limited scalability across portfolios
Heavy reliance on domain expertise
There was no centralized system to efficiently connect, structure, and validate building data at scale.
Additionally, the internal development tool had a poor user experience and lacked the flexibility needed to support growing integration demands.
The Goal
Design a platform that replaces the existing development tool and centralizes configuration and integration workflows, reducing reliance on third-party tools and streamlining the process of preparing building data for the analytics platform by:
Speeding up building integration
Reducing manual effort and errors
Scaling across multiple buildings and portfolios
Making complex data structures easier to understand and manage
The Process
Investigation
To better understand the problem space, I conducted an audit of the existing internal development tool and reviewed how configuration workflows were currently handled.
In parallel, I met with integrators and stakeholders to map out the full building integration process, including how third-party tools were used to connect, structure, and prepare data.
This helped identify gaps across both systems and highlighted opportunities to improve efficiency, reduce reliance on external tools, and create a more streamlined workflow.
Audit: Developer Tool
The existing internal tool was built for internal use and not designed as a customer-facing product. My goal was to identify the core functionality to carry forward and improve.
Key Findings
Customer management
A centralized customer table existed and served as the main entry point, but needed to evolve into a more robust workspace.
Configuration controls
Basic settings like feature toggles and data backfill were in place, but lacked structure and scalability.
Dashboard configuration
Early support for custom dashboards existed, but was limited and not user-friendly.
Foundation to build on
The tool contained the core building blocks, but required a redesigned experience to support real-world workflows.
Audit: Integration Process
To understand how building data was prepared for the analytics platform, I worked closely with integrators and stakeholders to map out the full integration workflow.
This included reviewing existing tools, observing real workflows, and identifying where time, effort, and complexity were concentrated.
Understanding the User
To ground the process in real-world use, I developed a user persona and mapped the full integration journey.
These helped highlight key pain points, dependencies, and the overall timeline required to move from raw data to actionable insights.
User Persona
Clark Sanford
|
38
|
Integrator
Clark has over a decade of experience in building automation and integration. He works with various Building Automation Systems (BAS) to configure and maintain building performance. His job requires precision and efficiency, as he is responsible for ensuring accurate data flows into analytics tools for fault detection and reporting.
Tools Used:
Building Automation and Integration Platforms.
Niagara Platform
Skyspark
Motivation
Efficiently configure buildings to enable fault detection, analytics, and reporting.
Needs
A streamlined way to map and tag data points.
The ability to apply rules to equipment quickly and accurately.
Tools that reduce manual, repetitive work and improve efficiency.
Pain Point
Integration is time-consuming, often taking weeks or more.
Configuring thousands of data points individually is tedious and inefficient.
Managing multiple buildings increases the complexity and workload.
User Journey
Integration Timeline: 4-8 weeks (longer for larger/multi-building campuses)
Primary Tool: Niagara Framework
Establishing Connection
Clark collaborates with the building owner, facilities team, and IT department (if needed) to connect to the BAS.
Once connected, he verifies that the data is flowing correctly and is ready to start the integration process.
Start
Week 1
Start
Week 2
Pain Points
Clark must configure each point individually, making this process extremely time-consuming and tedious.
Start
Week 3
Start
Week 4
Configuration
Defining Hierarchy:
Clark structures the building’s data, defining relationships between the building, sub-buildings, floors, equipment, and points.
Equipment Classification:
Assigns types to equipment (AHUs, boilers, cooling towers, pumps, VAVs, etc.).
Equipment Relationships:
Defines dependencies, such as which VAVs serve which AHUs.
Point Tagging:
Assigns metadata to individual data points.
Rule Application
Once the building’s data is structured, Clark applies rules to monitor equipment performance and trigger fault detection.
Start
Week 5
Start
Week 6
Pain Points
Clark has to manually build and apply each rule to individual pieces of equipment, increasing workload.
Pain Points
Building owners must wait 4-8 weeks for small buildings and 3-6 months for larger campuses before they can even start seeing actionable insights.
This delay extends the time required to realize energy savings, cost reductions, and performance improvements because optimizations can only be made after the data is available and analyzed.
Start
Week 7
Start
Week 8
End
Week 8
Analytics & Reporting
With the integration complete, Clark and the facilities team can now access analytics, fault detection, reports, and system insights.
Insights help identify cost savings, energy efficiency improvements, equipment performance issues, and occupant comfort concerns.
Clark and the facilities team relay these findings to the building owner to inform operational decisions.
End of journey: Clark completes the integration, but the extended timeline for data availability and analysis remains a challenge for both him and the building owner.
Integration Workflow
The integration process consisted of four main steps:

Key Findings
Time-intensive process
Integration could take several weeks before data was usable for analytics
Highly manual workflows
Large datasets required repetitive, point-by-point configuration
Inconsistent data structures
Naming conventions and organization varied across buildings
Reliance on third-party tools
External platforms were required to complete integration workflows
Opportunity: Bulk-Based Workflows
A key opportunity was shifting from manual, point-by-point configuration to bulk-based workflows.
For example:
Point mapping could be accelerated using pattern matching (regex) to map large groups of data
Equipment and point tagging could be applied to filtered datasets instead of individual selections
This approach significantly reduced the time and effort required to complete integrations and improved scalability across buildings.
Key Insight
Time is a critical factor in building integration.
Integrations could take anywhere from 4–8 weeks for smaller buildings to several months for larger campuses before any meaningful insights were available. This delay impacted not only building owners, but also integrators and service providers, who were required to dedicate significant time to a single project.
The opportunity was clear: reduce the time and effort required to complete integrations.
Design Direction
To address this, the platform was designed around bulk-based workflows that reduce manual effort and improve scalability.
Bulk Mapping & Tagging
Instead of configuring data points individually, users can group similar points and apply mappings and tags simultaneously, significantly reducing repetitive work while still allowing for individual adjustments when needed.
Pre-Built Rule Library with Bulk Updates
Users can quickly apply predefined rules rather than building them from scratch. Rule parameters can be adjusted and applied in bulk, allowing for both speed and flexibility.
User Roles
Synergy was primarily designed for integrators responsible for configuring and preparing building data.
Integrators
Responsible for connecting systems, mapping data, and completing the integration workflow
Admin
Has the same capabilities as an integrator, with additional access to user management
System Hierarchy
To support scalability across buildings and portfolios, a clear hierarchical structure was introduced:
Example Hierarchy Structure

This structure provided a consistent way to organize data, define relationships, and navigate complex systems.
The Design
The platform was designed around the core integration workflow, focusing on reducing manual effort, improving scalability, and supporting how integrators work with large datasets.
Customer Management
The platform begins with a centralized customer list, providing a single entry point to access analytics, manage customers, and begin the integration workflow.

From this view, users can:
Create and manage customers
Access the analytics platform for a selected customer
Access configuration features and settings
This replaces previously fragmented workflows with a single, organized workspace for managing customers and initiating the integration process.
Point Mapping
Mapping building data is one of the most time-intensive steps in the integration process, often involving thousands of data points with inconsistent naming conventions.
Each point is identified by a Metric ID, a structured string that represents its location within the building system.
To reduce manual effort, the interface was designed to support pattern-based mapping and bulk operations.

Full dataset of unmapped points with filtering and mapping tools available.
Users start with a full dataset of unmapped points, where each row represents a unique Metric ID pulled from the building’s automation system.
With datasets often reaching thousands of entries, manually mapping each point would be inefficient and time-consuming.

Pattern-based mapping using structured identifiers to group related data points.
Instead of mapping points individually, users can define patterns directly within the Metric ID.
By replacing portions of the string with structured identifiers like {building}, {equipment}, and {point}, users can group related data based on naming conventions.
This approach leverages pattern matching, allowing users to define entire groups without selecting each point manually.

Bulk mapping applied to multiple points simultaneously.
Once a pattern is defined and filtered, mappings can be applied to all matching points at once.
This transforms a repetitive, manual process into a scalable workflow, allowing large datasets to be mapped in significantly less time.
Key Insight
This workflow shifts the process from manual selection to pattern recognition.
Instead of configuring points one by one, users define rules that apply across entire datasets, enabling faster and more scalable integrations.
Tagging Workflows
Once data is mapped, tagging is used to standardize and structure that data so it can be used for analytics.
In building automation systems, tagging assigns meaning to each data point, defining what it represents, how it should be interpreted, and how it relates to other data. Without consistent tagging, building data remains difficult to search, analyze, and scale.
To support this, the interface was designed to enable filtering, selection, and bulk application of tags across large datasets.

Full dataset of mapped points with filtering and segmentation tools.
Users begin with a full dataset of mapped points, where filters and search tools can be used to narrow down specific groups.

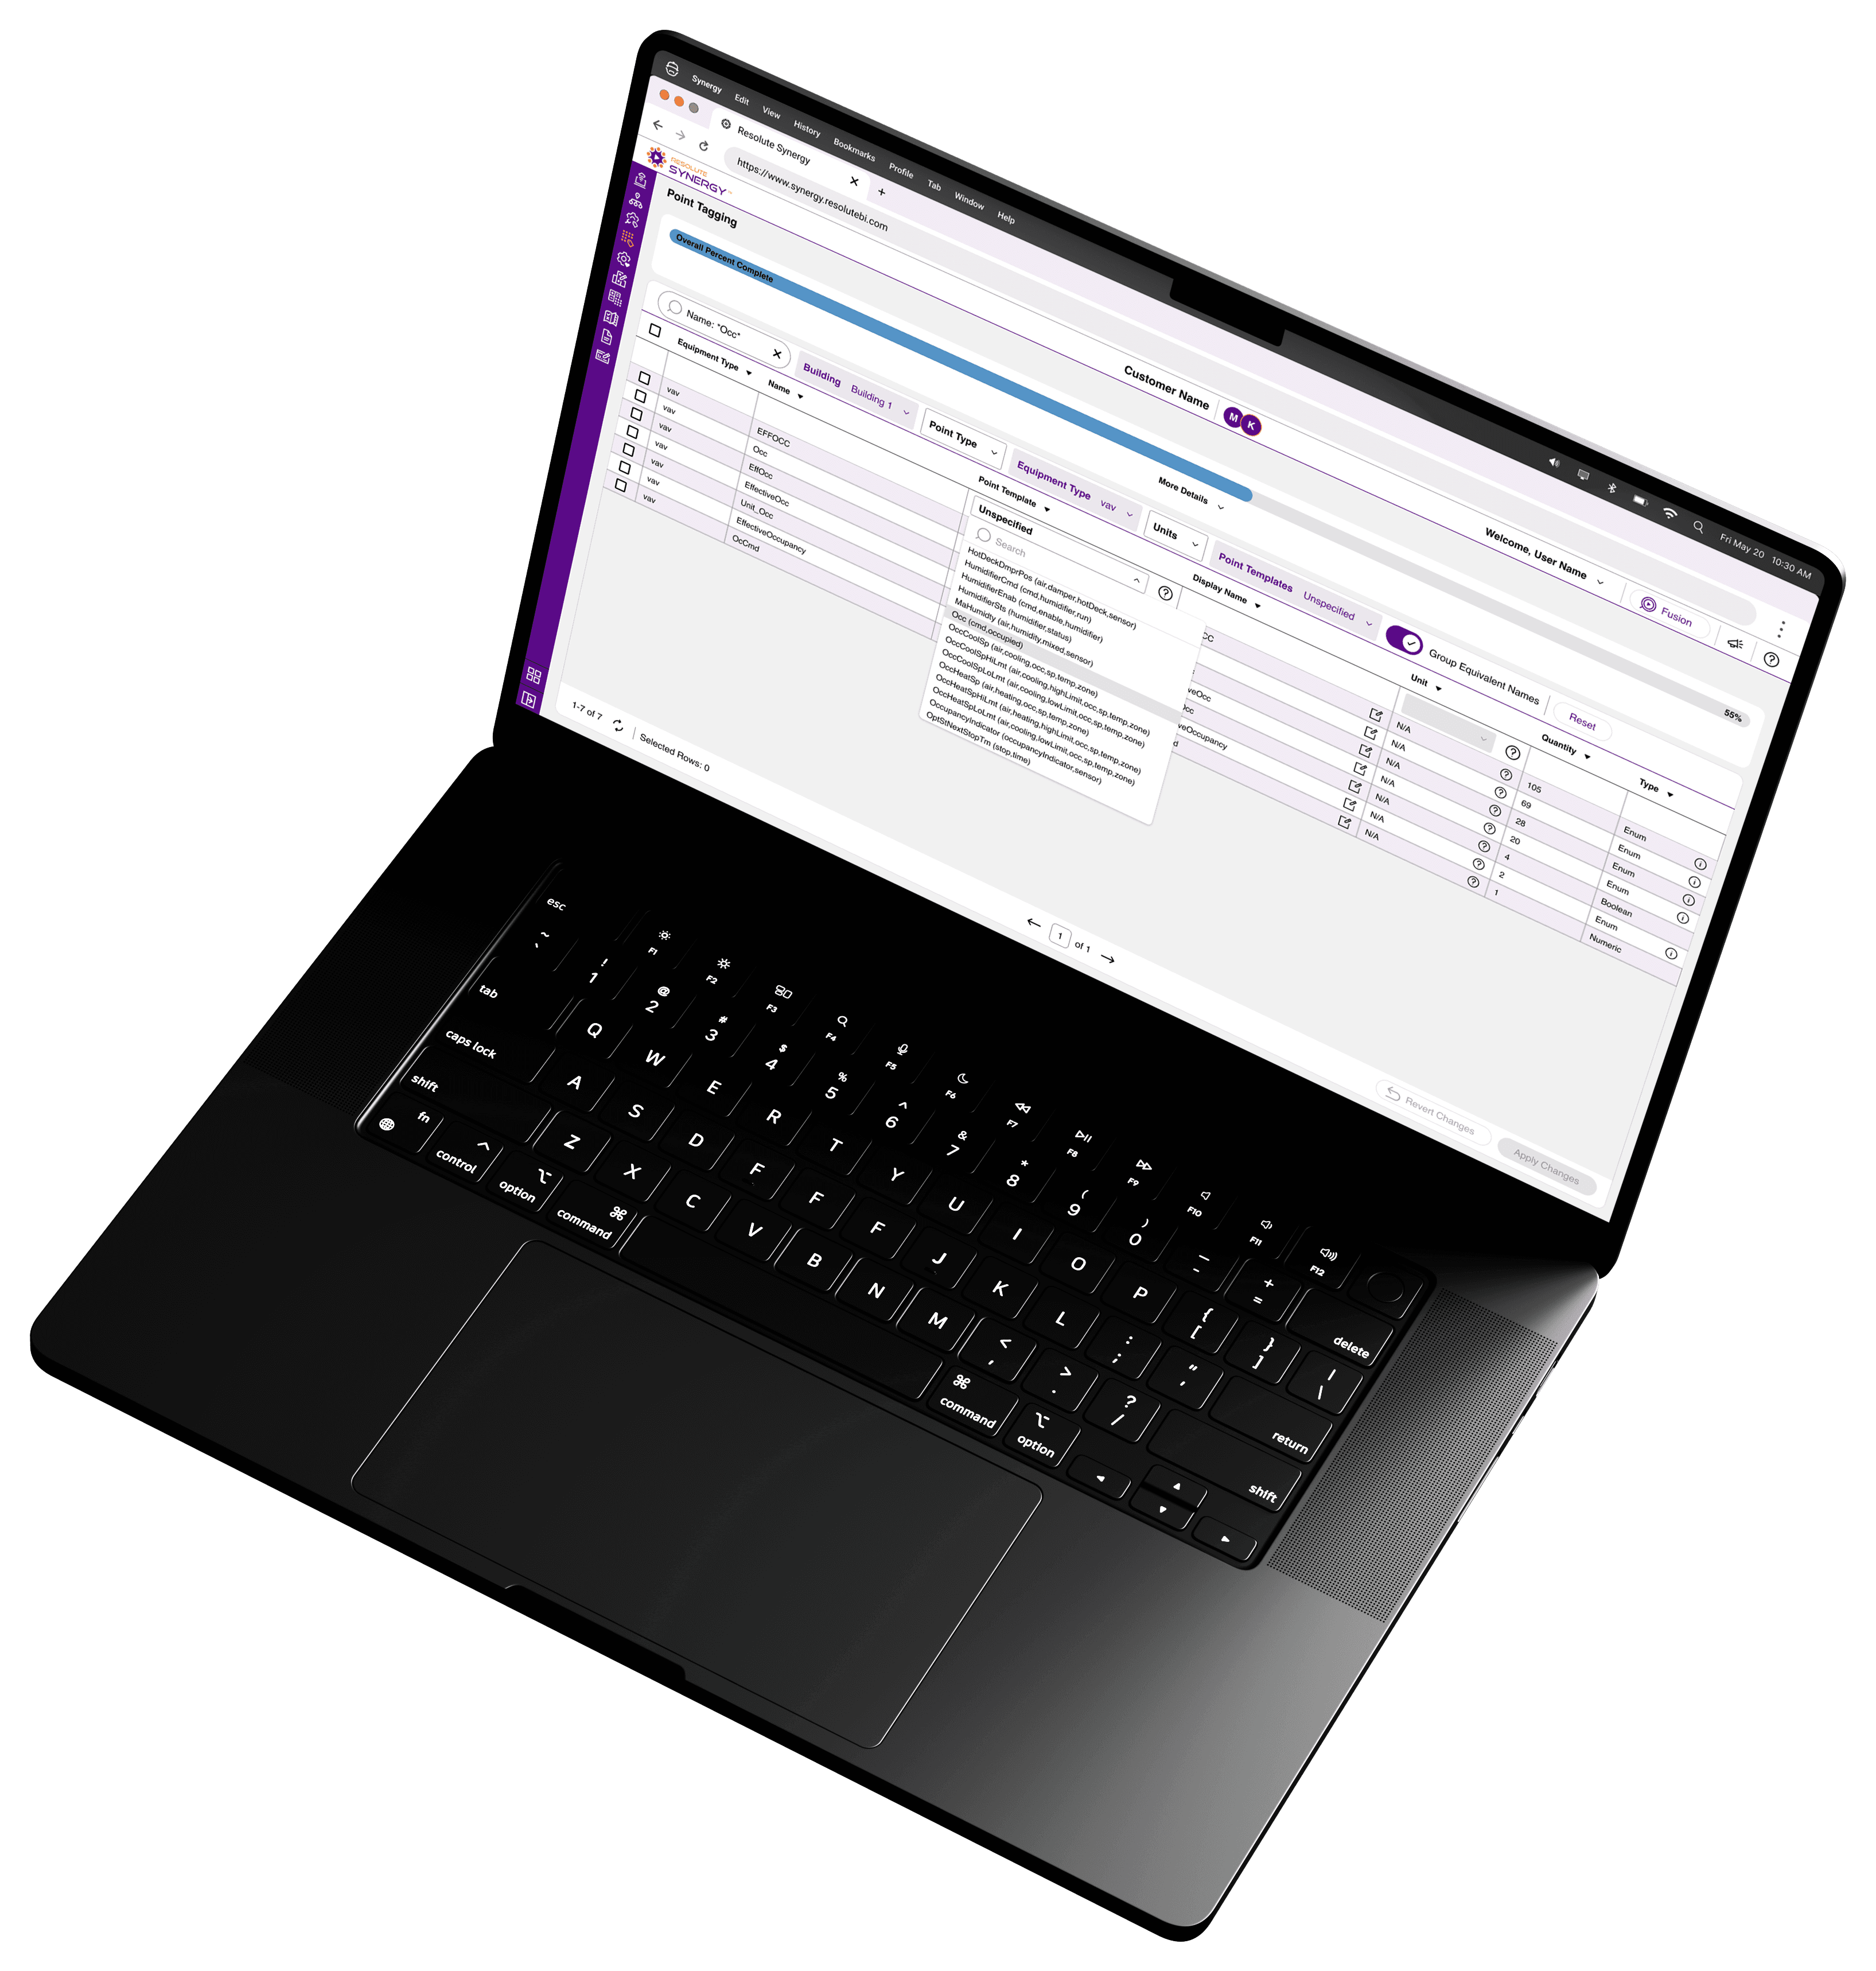
Selecting predefined point templates to standardize data.
Users can select from predefined point templates, which apply standardized metadata to each point.
These templates define attributes such as point type, units, and display naming, ensuring consistency across the system.

Bulk application of point templates across multiple data points.
Once a dataset is filtered and a template is selected, changes can be applied across all selected points at once.
This allows users to quickly standardize large datasets without manual configuration.
Key Insight
Tagging transforms raw data into structured, usable information.
By combining filtering with bulk application, the workflow enables users to efficiently standardize large datasets, reducing manual effort and improving data consistency across buildings.
Site Editor
While mapping and tagging workflows are designed for speed and bulk configuration, the Site Editor provides a more granular way to navigate and manage building data.
It serves as a centralized workspace for making targeted updates, allowing users to inspect and adjust configuration at any level of the hierarchy.

Portfolio-level view showing configuration progress and access to key workflows.
Users can start at the portfolio level to view overall configuration progress and quickly access different parts of the integration workflow.

Equipment-level view with asset details, tagging, and rule configuration.
As users navigate deeper into the hierarchy, they can select individual assets such as equipment to view and update configuration details.
This includes applying tags, enabling rules, and defining relationships between assets.

Point-level view recent metrics for quick data validation.
At the lowest level, users can inspect individual data points, view associated metadata, and verify that data is flowing correctly.
A lightweight metrics view provides a quick snapshot of recent data, allowing users to validate inputs without needing to launch the analytics platform.
Key Insight
The Site Editor complements bulk workflows by providing precision and flexibility.
While bulk tools accelerate the initial integration process, the Site Editor enables users to refine, validate, and maintain building data over time.
Rules
Rules enable analytics by monitoring building data and identifying potential issues.
Instead of requiring users to build rules from scratch, the platform provides a library of predefined rules that can be enabled and configured as needed.

Portfolio-level view showing configuration progress and access to key workflows.
Rules are organized into three categories:
Disabled – available rules that have not yet been enabled
Enabled – active rules currently applied to assets
Prospects – rules that require additional configuration before they can be enabled
Users can:
Browse and filter available rules
Enable rules individually or in bulk
Apply rules across multiple assets
This approach reduces setup time while ensuring consistency across buildings.
Key Insight
Providing a predefined rule library allows users to quickly activate analytics without requiring deep technical setup.
By combining filtering, categorization, and bulk enablement, rules can be applied at scale while still guiding users toward additional configuration opportunities.
Expected Impact
Synergy was designed to improve the speed and scalability of building integration.
Traditionally, integrating a building into an analytics platform could take weeks or months. By introducing bulk workflows, pattern-based mapping, and standardized tagging, the platform reduces the manual effort required to configure large datasets.
Key Improvements Include:
Faster integration through bulk mapping and tagging
Reduced manual effort by eliminating repetitive configuration
Improved data consistency through standardized tagging and rules
Scalability across large portfolios and complex systems
Innovation & Recognition
The approach to structuring and processing building data through bulk operations and rule-based analytics contributed to a patented system developed by Resolute Building Intelligence.
Patent Number: 11708987
Keith Murphy
Product Designer
2026
Contact
Email: kmurphy@themurphyfiles.com
Phone: (248) 878-5538
Social